|
Novus Biologicals
antibodies 1 2000 anti fancd2 novus biologicals cat no nb100 182ss  Antibodies 1 2000 Anti Fancd2 Novus Biologicals Cat No Nb100 182ss, supplied by Novus Biologicals, used in various techniques. Bioz Stars score: 95/100, based on 1 PubMed citations. ZERO BIAS - scores, article reviews, protocol conditions and more https://www.bioz.com/product/nb100+182ss/FANCD2+Antibody+-+BSA+Free/pmc07473174-394-10-13 Average 95 stars, based on 1 article reviews
antibodies 1 2000 anti fancd2 novus biologicals cat no nb100 182ss - by Bioz Stars,
2026-09
95/100 stars
|
Buy from Supplier |
|
Bethyl
nb100 182ss Nb100 182ss, supplied by Bethyl, used in various techniques. Bioz Stars score: 94/100, based on 1 PubMed citations. ZERO BIAS - scores, article reviews, protocol conditions and more https://www.bioz.com/product/nb100+182ss/FANCD2+Antibody/pm40382323-444-6-9 Average 94 stars, based on 1 article reviews
nb100 182ss - by Bioz Stars,
2026-09
94/100 stars
|
Buy from Supplier |
|
Novus Biologicals
fancd2  Fancd2, supplied by Novus Biologicals, used in various techniques. Bioz Stars score: 94/100, based on 1 PubMed citations. ZERO BIAS - scores, article reviews, protocol conditions and more https://www.bioz.com/product/nb100+182ss/FANCD2+Antibody+%5BBiotin%5D/pmc12802942-94-9-11 Average 94 stars, based on 1 article reviews
fancd2 - by Bioz Stars,
2026-09
94/100 stars
|
Buy from Supplier |
|
Santa Cruz Biotechnology
fancd2  Fancd2, supplied by Santa Cruz Biotechnology, used in various techniques. Bioz Stars score: 91/100, based on 1 PubMed citations. ZERO BIAS - scores, article reviews, protocol conditions and more https://www.bioz.com/product/nb100+182ss/FANCD2+Lentiviral+Activation+Particles/pmc06753070-271-40-49 Average 91 stars, based on 1 article reviews
fancd2 - by Bioz Stars,
2026-09
91/100 stars
|
Buy from Supplier |
|
Novus Biologicals
fancd2 antibody  Fancd2 Antibody, supplied by Novus Biologicals, used in various techniques. Bioz Stars score: 90/100, based on 1 PubMed citations. ZERO BIAS - scores, article reviews, protocol conditions and more https://www.bioz.com/product/nb100+182ss/FANCD2+Antibody/pmc07261159-68-22-25 Average 90 stars, based on 1 article reviews
fancd2 antibody - by Bioz Stars,
2026-09
90/100 stars
|
Buy from Supplier |
|
Proteintech
fancd2  Fancd2, supplied by Proteintech, used in various techniques. Bioz Stars score: 93/100, based on 1 PubMed citations. ZERO BIAS - scores, article reviews, protocol conditions and more https://www.bioz.com/product/nb100+182ss/Phospho-FANCD2+(Ser330)+Antibody/bio_rxiv__2020__10__23__352070-105-12-19 Average 93 stars, based on 1 article reviews
fancd2 - by Bioz Stars,
2026-09
93/100 stars
|
Buy from Supplier |
|
Novus Biologicals
antibody against fancd2  Antibody Against Fancd2, supplied by Novus Biologicals, used in various techniques. Bioz Stars score: 94/100, based on 1 PubMed citations. ZERO BIAS - scores, article reviews, protocol conditions and more https://www.bioz.com/product/nb100+182ss/FANCD2+Antibody+(FI-17)/pmc12227572-400-8-11 Average 94 stars, based on 1 article reviews
antibody against fancd2 - by Bioz Stars,
2026-09
94/100 stars
|
Buy from Supplier |
Image Search Results
Journal: Cell reports
Article Title: The ZGRF1 Helicase Promotes Recombinational Repair of Replication-Blocking DNA Damage in Human Cells
doi: 10.1016/j.celrep.2020.107849
Figure Lengend Snippet: (A) Quantification of chromosomal aberrations in HCT116 parental and ZGRF1 −/− cells. Means with 95% confidence intervals are plotted. p values were calculated using Mann-Whitney U tests. N ≥ 32 spreads per condition. (B and C) Examples of metaphase spreads from parental cells (B) or ZGRF1 −/− cells (C) untreated or treated with 20 ng/mL MMC for 24 h. White arrows mark chromosomal aberrations. The images shown highlight the types of aberrations scored rather than being representative of the number of aberrations seen per spread. (D) ZGRF1 −/− cells show a higher frequency of co-localizing γ-H2AX and FANCD2 foci under both unperturbed conditions and when treated with MMC. Quantification of co-localizing γ-H2AX and FANCD2 foci under unperturbed conditions and with two different treatments with MMC is shown. Error bars show 95% confidence intervals. p values were calculated using Mann-Whitney U tests. N > 100 cells for each condition. (E) Representative images of HCT116 parental and ZGRF −/− cells under unperturbed conditions or after treatment with 20 ng/mL MMC for 4 h. Arrows mark co-localizing foci for one cell, where the pixel intensity of FANCD2 foci was a minimum of 6,000 arbitrary units higher than background. Cells with very low or absent γ-H2AX foci were not scored, as this indicated inadequate immunostaining. (F) Colony formation assay of HCT116 parental and ZGRF1 −/− and FANCM −/− single- and double-mutant cell lines treated with the indicated doses of MMC for 24 h. The graph of the parental cell line is statistically different from each of the knockout cell lines (p < 0.05, t test), but the knockout cell lines are not significantly different from each other (n.s.). (G) Colony formation assay of HCT116 parental and ZGRF1 −/− and FANCJ single- and double-mutant cell lines treated with the indicated doses of MMC for 24 h. The graph of the parental cell line is statistically different from the ZGRF1-knockout cell line (p < 0.05, t test). The FANCJ single- and double-mutant cell lines are not significantly different from each other (n.s.). Graphs in (F) and (G) show the mean with 95% confidence interval. Statistical significance was calculated using unpaired t tests without assuming consistent SD. *p < 0.05. n.s., no significant difference. n ≥ 3 for each cell line.
Article Snippet: Cells were washed twice with PBS and incubated with primary
Techniques: MANN-WHITNEY, Immunostaining, Colony Assay, Mutagenesis, Knock-Out

Journal: Cell reports
Article Title: The ZGRF1 Helicase Promotes Recombinational Repair of Replication-Blocking DNA Damage in Human Cells
doi: 10.1016/j.celrep.2020.107849
Figure Lengend Snippet: (A) ZGRF1 localizes to nuclear foci during ICL repair. Cells expressing ZGRF1–2xYFP from the endogenous promoter were synchronized at the G1/S border by treatment with 2 mM thymidine for 18 h before release into S phase in Leibovitz’s L-15 medium containing 0.4 μM Hoechst 33258. Four hours before release, 20 ng/mL of MMC or vehicle was added to the cultures. Arrows indicate ZGRF1 foci. (B) Quantification of ZGRF1 foci after MMC treatment. Quantification of the experiment in (A). Error bars show 95% confidence intervals. p values were calculated using Mann-Whitney U tests. N = 90–160 cells for each condition. (C) Colocalization of ZGRF1 and FANCD2. Cells expressing ZGRF1–2xYFP from the endogenous promoter and ectopically integrated mCherry-FANCD2 were synchronized in S phase with 2 mM thymidine 18 h prior to microscopy. Four hours before microscopy, 20 ng/mL MMC or vehicle was added to the culture. Yellow arrows mark ZGRF1 foci, red arrows mark FANCD2 foci, and orange arrows mark the co-localizing foci. (D) Quantification of co-localizing FANCD2 and ZGRF1 foci in the experiment reported in (C). Error bars show 95% confidence intervals. p values were calculated using Mann-Whitney U tests. N > 400 cells for each condition.
Article Snippet: Cells were washed twice with PBS and incubated with primary
Techniques: Expressing, MANN-WHITNEY, Microscopy

Journal: Cell reports
Article Title: The ZGRF1 Helicase Promotes Recombinational Repair of Replication-Blocking DNA Damage in Human Cells
doi: 10.1016/j.celrep.2020.107849
Figure Lengend Snippet: KEY RESOURCES TABLE
Article Snippet: Cells were washed twice with PBS and incubated with primary
Techniques: Imaging, Western Blot, Virus, Recombinant, Protease Inhibitor, In Situ, Plasmid Preparation, Software
Journal: Nucleic Acids Research
Article Title: The SMC5/SMC6 complex is critical for resolving R-loop-induced transcription–replication conflicts
doi: 10.1093/nar/gkaf1537
Figure Lengend Snippet: SMC5/6 is recruited to the sites of TRC in proximity to SETX and plays an important role in suppressing TRC. ( A, B, C, D, E ) U2OS WT cells were treated with vehicle or HU (2 mM) for 2 h and then subjected to PLA analysis showing colocalization between SETX and R-loops (A), SETX and PCNA (B), SETX and FANCD2 (C), SMC5-Flag and R-loop (D, left), SMC5-Flag and FANCD2 (D, right), and SMC5-Flag and SETX (E). ( F ) U2OS WT and SETX -KO cells with or without RNaseH1 expression were subjected to PLA analysis showing colocalization between replication (PCNA) and transcription (pPOLR2A). ( G ) U2OS WT and SETX -KO cells, with or without RNaseH1 expression, were subjected to PLA analysis showing colocalization between SMC5-Flag and R-loops (S9.6). ( H ) U2OS WT and SETX -KO cells with or without RNaseH1 expression were subjected to PLA analysis showing colocalization between SMC5-Flag and FANCD2. ( I ) U2OS WT and SETX -KO cells were infected with SMC5 shRNA or vector, with or without RNaseH1 expression. Three days after infection, cells were used for PLA analysis showing colocalization between replication (PCNA) and transcription (pPOLR2A).
Article Snippet: Primary antibodies used for immunostaining: S9.6 antibody (ENH001, Kerafast),
Techniques: Expressing, Infection, shRNA, Plasmid Preparation

Journal: Nucleic Acids Research
Article Title: The SMC5/SMC6 complex is critical for resolving R-loop-induced transcription–replication conflicts
doi: 10.1093/nar/gkaf1537
Figure Lengend Snippet: SMC5/6 is required for recruitment of BLM/TOP3A/RMI (BTRR) complex to TRC. ( A, B, C, D ) U2OS WT and SETX -KO cells with or without RNASEH1 expression were subjected to PLA analysis showing colocalization between TOP3A and FANCD2 (A), TOP3A and SMC5-Flag (B left), TOP3A and R-loops (B right), BLM and SMC5-Flag (C left), RMI1 and SMC5-Flag (C right), BLM and R-loops (D left), and RMI1 and R-loops (D right). ( E ) U2OS SETX -KO cells were infected with SMC5 shRNA or vector. Three days after infection, cells were used for PLA analysis showing colocalization between BLM and R-loops (left), TOP3A and R-loops (middle), and RMI1 and R-loops (right). ( F ) U2OS WT cells were infected with shRNA to knock down indicated genes. Three days after infection, cells were used for PLA analysis showing colocalization between SMC5-Flag and R-loops (S9.6). ( G ) U2OS WT cells were infected with shRNA to knock down indicated genes. Three days after infection, cells were subjected to PLA analysis showing colocalization between replication (PCNA) and transcription (pPOLR2A).
Article Snippet: Primary antibodies used for immunostaining: S9.6 antibody (ENH001, Kerafast),
Techniques: Expressing, Infection, shRNA, Plasmid Preparation, Knockdown

Journal: Nucleic Acids Research
Article Title: The SMC5/SMC6 complex is critical for resolving R-loop-induced transcription–replication conflicts
doi: 10.1093/nar/gkaf1537
Figure Lengend Snippet: SLF2 is required for SMC5/6 loading to TRCs upon SETX loss. ( A ) U2OS SETX-KO cells were infected with SLF2 shRNA or vector. Three days after infection, cells were subjected to PLA analysis showing colocalization between SMC5-Flag and FANCD2. ( B ) U2OS WT cells were infected with SLF2 shRNA or vector. Three days after infection, cells were subjected to PLA analysis showing colocalization between replication (PCNA) and transcription (pPOLR2A). ( C ) U2OS WT and SLF2 -KO cells were infected with SETX shRNA or vector. Three days after infection, cells were harvested for western blotting using the antibodies indicated. ( D ) U2OS WT cells were infected with shRNA to knock down indicated genes. Three days after infection, cells were resuspended and seeded on new plates for colony formation assay (left) and monitoring growth speed (right).
Article Snippet: Primary antibodies used for immunostaining: S9.6 antibody (ENH001, Kerafast),
Techniques: Infection, shRNA, Plasmid Preparation, Western Blot, Knockdown, Colony Assay

Journal: Nucleic Acids Research
Article Title: The SMC5/SMC6 complex is critical for resolving R-loop-induced transcription–replication conflicts
doi: 10.1093/nar/gkaf1537
Figure Lengend Snippet: FANCD2 activation depends on BTRR. ( A ) U2OS WT and SETX -KO cells with or without RNASEH1 expression were used for immunostaining with antibody against FANCD2. ( B ) SMC6-Flag-expressing U2OS WT and SETX -KO cells, with or without RNaseH1 expression, were subjected to PLA analysis showing colocalization between SMC6-Flag and FANCD2. ( C ) U2OS WT and SETX -KO cells with or without RNASEH1 expression were subjected to PLA analysis showing colocalization between BLM and FANCD2. ( D ) U2OS SETX -KO cells were infected with shRNA to knock down indicated genes. Three days after infection, cells were used for immunostaining with an antibody against FANCD2. ( E ) U2OS WT cells were infected with shRNA to knock down indicated genes. Three days after infection, cells were subjected to PLA analysis showing colocalization between FANCD2 and R-loops (S9.6). ( F ) U2OS WT cells were infected with FANCD2 shRNA or vector. Three days after infection, cells were subjected to PLA analysis showing colocalization between SMC5-Flag and BLM (left), SMC5-Flag and TOP3A (middle), and SMC5-Flag and RMI1 (right).
Article Snippet: Primary antibodies used for immunostaining: S9.6 antibody (ENH001, Kerafast),
Techniques: Activation Assay, Expressing, Immunostaining, Infection, shRNA, Knockdown, Plasmid Preparation

Journal: Nucleic Acids Research
Article Title: The SMC5/SMC6 complex is critical for resolving R-loop-induced transcription–replication conflicts
doi: 10.1093/nar/gkaf1537
Figure Lengend Snippet: BTRR is important for recruiting FANCM to activate FANCD2 at TRCs. ( A ) U2OS WT and SETX -KO cells with Flag-FANCM expression were subjected to PLA analysis showing colocalization between SMC6 and Flag-FANCM. ( B ) U2OS SETX -KO cells were infected with FANCM shRNA or vector. Three days after infection, cells were analyzed using PLA to assess colocalization between SMC5-Flag and FANCD2 (left) or subjected to immunostaining with an anti-FANCD2 antibody (right). ( C ) U2OS SETX -KO cells with Flag-FANCM expression were infected with shRNA to knock down indicated genes. Three days after infection, cells were subjected to PLA analysis showing colocalization between SMC6 and Flag-FANCM. ( D ) U2OS SETX -KO cells expressing flag-FANCM-WT or Flag-FANCM-MM2 with silent mutations resistant to its FANCM shRNA were infected with FANCM shRNA to deplete endogenous FANCM. Three days after infection, cells were subjected to PLA analysis showing colocalization between SMC6 and Flag-FANCM. ( E ) Illustration of SMC5/6-mediated resolution of TRC in SETX-deficient cells. Positive supercoiling accumulates at TRC sites due to SETX loss. The SMC5/6 complex recognizes the supercoiling signals and recruits BTRR to relieve the tension. Meanwhile, BTRR recruits FANCM through direct interaction, ultimately activating FANCD2 to resolve TRCs.
Article Snippet: Primary antibodies used for immunostaining: S9.6 antibody (ENH001, Kerafast),
Techniques: Expressing, Infection, shRNA, Plasmid Preparation, Immunostaining, Knockdown
Journal: Nature Communications
Article Title: MRE11-RAD50-NBS1 promotes Fanconi Anemia R-loop suppression at transcription–replication conflicts
doi: 10.1038/s41467-019-12271-w
Figure Lengend Snippet: MRN functions in the Fanconi Anemia pathway to recruit FA proteins to R-loops. a and b Epistatic effects on nuclear S9.6-staining intensity in the indicated conditions. Aquarius (AQR) is a splicing helicase and R-loop regulator in a different pathway, and AQR depletion showed additive nuclear S9.6 staining increases with si-FANCD2 in a . N = 3; **** P < 0.0001 by ANOVA; mean ± SD. c Quantification of nuclear FANCD2 foci by immunofluorescence in the indicated cell conditions. Three replicate experiments were performed and the aggregate foci counts were compared by Fisher Exact test and Bonferroni corrected p value cutoffs were used. * P < 0.05 and ** P < 0.01. d and e ChIP of FANCM and BLM at R-loop prone loci BTBD and TFPT depends on RAD50. N = 3; * P < 0.05 and ** P < 0.01 by t test; mean ± SEM. Cartoons illustrating the MRN-FA pathway a , b and the positive effects of RAD50 on FANCM/BLM recruitment are shown beside each panel
Article Snippet: For γH2AX, FANCD2, and p-ATM foci, the immunostaining was performed the same way except fixation with 4% paraformaldehyde for 15 min and permeabilization with 0.2% Triton X-100 for 5 min on ice for γH2AX (1:1000, H2A.X(phosphor S139) [EP854(2)Y], ab81299, abcam),
Techniques: Staining, Immunofluorescence
Journal: Nucleic Acids Research
Article Title: A distinct role for recombination repair factors in an early cellular response to transcription–replication conflicts
doi: 10.1093/nar/gkaa268
Figure Lengend Snippet: Cdk9 inhibitors induce transient FANCD2 focus formation and FANCD2 is required for cellular survival in response to the inhibitors. ( A ) Left, quantification of FANCD2 foci at the indicated time points after addition of 1 μM flavo, 50 μM DRB or 1 μM MC295 using the DT40 cell line FANCD2 +/Venus TopBP1 +/+/ mCherry PICH +/TFP . Mean values and error bars representing 95% confidence interval are indicated. Number of cells analysed is indicated (n). Right, representative images of Venus-FANCD2 in flavo-, DRB- and MC295-treated DT40 FANCD2 +/Venus TopBP1 +/+/mCherry PICH +/TFP cells at the indicated time points. Scale bar: 5 μm. ( B ) Left, quantification of FANCD2 foci detected by immunostaining of U2OS cells at the indicated time points after addition of 1 μM flavo or 100 nM cisplatin. Mean values and error bars representing 95% confidence interval are indicated. Number of cells analysed is indicated ( n ). Right, representative images of FANCD2-immunostaining of flavo-treated U2OS cells at the indicated time points. Scale bar: 5 μm. ( C ) Quantification of colony survival assay of DT40 WT or FANCD2 − / − cells in response to the indicated drug treatments normalized to untreated. Results are mean of three independent experiments. Error bars are standard deviations. For all panels in this figure: *** P < 0.001, **** P < 0.0001. Ns, not significant ( P > 0.05). Two-tailed t -test.
Article Snippet: Cells were blocked in PBS-T (PBS with 0.1% Tween20) with 3% BSA (A0281, Sigma-Aldrich) for 1 h before overnight incubation with primary
Techniques: Immunostaining, Clonogenic Cell Survival Assay, Two Tailed Test

Journal: Nucleic Acids Research
Article Title: A distinct role for recombination repair factors in an early cellular response to transcription–replication conflicts
doi: 10.1093/nar/gkaa268
Figure Lengend Snippet: Transient inhibition of Cdk9 leads to T–R conflicts. ( A ) Quantification of FANCD2 foci in DT40 population FACS-enriched for G1, S or G2/M phases as indicated. Cells were either untreated or treated with 1 μM flavo for 1 h. Mean values and error bars representing 95% confidence interval are indicated. Number of cells analysed is indicated ( n ). ( B ) Quantification of colony survival assay of DT40 WT or FANCD2 − / − cell population FACS-enriched for G1, S or G2/M phases. Cells were either untreated or treated with 1 μM flavo for 1 h as indicated. Results are mean of three independent experiments. Error bars are standard deviations. Indications of significance (ns and *) refer to comparison with the untreated or WT. ( C ) Quantification of PLA foci between RNAP II CTD Ser5P and PCNA in U2OS cells treated with DMSO or flavo for the indicated time. Mean values and error bars representing 95% confidence intervals are indicated. Number of cells analysed is indicated (n). ( D ) Representative images of the PLA assay in U2OS cell with DMSO or flavo treatment for the indicated time. Scale bar: 6 μM. For all panels in this figure: * P < 0.05, **** P < 0.0001. Ns, not significant ( P > 0.05). Two-tailed t -test.
Article Snippet: Cells were blocked in PBS-T (PBS with 0.1% Tween20) with 3% BSA (A0281, Sigma-Aldrich) for 1 h before overnight incubation with primary
Techniques: Inhibition, Clonogenic Cell Survival Assay, Comparison, Two Tailed Test

Journal: Nucleic Acids Research
Article Title: A distinct role for recombination repair factors in an early cellular response to transcription–replication conflicts
doi: 10.1093/nar/gkaa268
Figure Lengend Snippet: RNA–DNA hybrids induced by transcription-stalling drugs, flavo and DRB, trigger FANCD2 focus formation. ( A ) Quantification of dot blot analysis. The level of RNA–DNA hybrids per input dsDNA is normalized against that of FANCD2 − / − untreated. Results are mean of three independent experiments. Error bars represent mean with standard deviations. ( B ) Quantification of RNA–DNA hybrid immunostaining. Signal intensity in arbitrary units (a.u.) of RNA–DNA hybrids per cell in DT40 WT or FANCD2 − / − cells before or after the indicated drug treatments. Mean values and error bars representing 95% confidence interval are indicated. Number of cells analysed is indicated ( n ). ( C ) DRIP-qPCR analysis of SAE1 gene in U2OS cells treated with DMSO or flavo. The amount of DRIP-qPCR product is plotted relative to qPCR for input (% input). Results are mean of three independent experiments. Error bars are standard deviations. Positions of the amplicons are shown as blue lines with numbers below. ( D ) FANCD2 foci in the DT40 cell line FANCD2 Venus/Venus were quantified at the indicated time points after addition of 1 μM flavo in cells that were or were not transiently transfected with mCherry-RNase H1 expressing plasmid. Mean values and error bars representing 95% confidence intervals are indicated. Number of cells analysed is indicated ( n ). ( E ) Representative images of the DT40 cell line FANCD2 Venus/Venus at the indicated time points after addition of 1 μM flavo in cells that were (bottom) or were not (top) transiently transfected with mCherry-RNase H1 expressing construct. Scale bar: 5 μm. For all panels in this figure: *** P < 0.001, **** P < 0.0001. Ns, not significant ( P > 0.05). Two-tailed t -test.
Article Snippet: Cells were blocked in PBS-T (PBS with 0.1% Tween20) with 3% BSA (A0281, Sigma-Aldrich) for 1 h before overnight incubation with primary
Techniques: Dot Blot, Immunostaining, Transfection, Expressing, Plasmid Preparation, Construct, Two Tailed Test

Journal: Nucleic Acids Research
Article Title: A distinct role for recombination repair factors in an early cellular response to transcription–replication conflicts
doi: 10.1093/nar/gkaa268
Figure Lengend Snippet: Monoubiquitylation of FANCD2 is dispensable for the TRe response, whereas basal activity of ATR is required. ( A ) Western blot to detect monoubiquitylated Venus-FANCD2 (ub-FANCD2) and non-ubiquitylated Venus-FANCD2 (FANCD2) in extracts from DT40 FANCD2 +/Venus subjected to the indicated drug treatments before harvest. ( B ) Quantification of colony survival assay of DT40 WT, FANCD2 − / − , FANCD2-K563R or FANCI − / − cells in response to the indicated drug treatments. Results are mean of three independent experiments. Error bars are standard deviations. ( C ) Quantification of colony survival assay of PD20 cells complemented with empty vector, hFANCD2 or hFANCD2-K561R in response to 1 μM flavo for the indicated duration. The experiment was done in triplicate. Error bars are standard deviations. ( D ) Western blot to assay ATR activation by detection of CHK1 phosphorylation at Ser345 (CHK1-Ser345P) and total CHK1 in extracts from FANCD2 +/Venus cells subjected to the indicated drug treatments. Tubulin was used as a loading control. ( E ) Left, quantification of FANCD2 foci in FANCD2 +/Venus with or without 30 min treatment with 1 μM flavo and/or 100 nM AZ20 as indicated. Mean values and error bars representing 95% confidence intervals are indicated. Number of cells analysed is indicated (n). Right, representative images of Venus-FANCD2 in flavo- or/and AZ20-treated DT40 FANCD2 +/Venus cells at the indicated time points. Scale bar: 5 μm. ( F ) Western blot to assay ATM activation by detection of ATM autophosphorylation at Ser1981, CHK2 phosphorylation at Thr68 and total ATM in extracts from U2OS cells incubated with flavo for the indicated durations or subjected to irradiation (IR) with 10 Gray (Gy). Tubulin was used as a loading control. ( G ) Quantification of FANCD2 foci at the indicated time points after addition of 1 μM flavo and 200 nM CHIR-124 using the DT40 cell line FANCD2 +/Venus TopBP1 +/+/mCherry RPA +/CFP . Mean values and error bars representing 95% confidence interval are indicated. For all panels in this figure: * P < 0.05, ** P < 0.01. Ns, not significant ( P > 0.05). Two-tailed t -test.
Article Snippet: Cells were blocked in PBS-T (PBS with 0.1% Tween20) with 3% BSA (A0281, Sigma-Aldrich) for 1 h before overnight incubation with primary
Techniques: Activity Assay, Western Blot, Clonogenic Cell Survival Assay, Plasmid Preparation, Activation Assay, Phospho-proteomics, Control, Incubation, Irradiation, Two Tailed Test

Journal: Nucleic Acids Research
Article Title: A distinct role for recombination repair factors in an early cellular response to transcription–replication conflicts
doi: 10.1093/nar/gkaa268
Figure Lengend Snippet: BLM and FANCD2 work together in the cellular response to T–R conflicts. ( A ) Quantification of colony survival assay of DT40 WT, BLM − / − or FANCJ − / − cells in response to the indicated drug treatments. Results are mean of three independent experiments. Error bars are standard deviations. ( B ) Quantification of BLM and FANCD2 colocalizing foci in the DT40 cell line BLM − / − FANCD2 +/Venus stably expressing mCherry-BLM at the indicated time points after treatment with flavo. Mean values and error bars representing 95% confidence interval are indicated. Number of cells analysed is indicated (n). ( C ) Representative images of Venus-FANCD2 and mCherry-BLM in flavo-treated DT40 BLM − / − FANCD2 +/Venus cells stably expressing mCherry-BLM at the indicated time points. Scale bar: 5 μm. ( D ) Quantification of BLM foci in the DT40 cell line FANCD2 − / − stably expressing mCherry-BLM (left) or FANCD2 foci in the DT40 cell line BLM − / − FANCD2 +/Venus (right) at the indicated time points after addition of 1 μM flavo. Mean values and error bars representing 95% confidence interval are indicated. Number of cells analysed is indicated (n). For all panels in this figure: * P < 0.05, ** P < 0.01. Ns, not significant ( P > 0.05). Two-tailed t -test.
Article Snippet: Cells were blocked in PBS-T (PBS with 0.1% Tween20) with 3% BSA (A0281, Sigma-Aldrich) for 1 h before overnight incubation with primary
Techniques: Clonogenic Cell Survival Assay, Stable Transfection, Expressing, Two Tailed Test

Journal: Nucleic Acids Research
Article Title: A distinct role for recombination repair factors in an early cellular response to transcription–replication conflicts
doi: 10.1093/nar/gkaa268
Figure Lengend Snippet: BRCA2 acts in concert with FANCD2 and BLM in the TRe response. ( A ) Quantification of FANCD2 and BRCA2 colocalizing foci in the DT40 cell line BRCA2 +/TFP FANCD2 +/Venus at the indicated time points after addition of 1 μM flavo. Mean values and error bars representing 95% confidence interval are indicated. Number of cells analysed is indicated ( n ). ( B ) Quantification of colony survival assay of DT40 BRCA2 +/ − or BRCA2 − / − cells in response to the indicated drug treatments. Results are mean of three independent experiments. Error bars are standard deviations. ( C ) Quantification of BRCA2 foci in the DT40 cell line BLM − / − BRCA2 +/eYFP (left) or BRCA2 and BLM foci in the DT40 cell line BLM − / − BRCA2 +/eYFP stably expressing mCherry-BLM (right) at the indicated time points after addition of 1 μM flavo. Mean values and error bars representing 95% confidence interval are indicated. Number of cells analysed is indicated ( n ). ( D ) Representative images of mCherry-BLM and BRCA2-YFP in flavo-treated DT40 BLM − / − BRCA2 +/eYFP cells stably expressing mCherry-BLM at the indicated time points. Scale bar: 5 μm. For all panels in this figure: * P < 0.05. Two-tailed t -test.
Article Snippet: Cells were blocked in PBS-T (PBS with 0.1% Tween20) with 3% BSA (A0281, Sigma-Aldrich) for 1 h before overnight incubation with primary
Techniques: Clonogenic Cell Survival Assay, Stable Transfection, Expressing, Two Tailed Test

Journal: Nucleic Acids Research
Article Title: A distinct role for recombination repair factors in an early cellular response to transcription–replication conflicts
doi: 10.1093/nar/gkaa268
Figure Lengend Snippet: FANCD2 prevents DNA damage and genomic instability after T–R conflicts. ( A ) Left, representative images of metaphase chromosomes from untreated or flavo-treated DT40 WT or FANCD2 − / − cells. Close up image shows break indicated by red arrow. Scale bar: 7.8 μm. Right, quantification of chromosomal aberrations on metaphase macrochromosomes from DT40 WT or FANCD2 − / − cells untreated or treated with 1 μM flavo for 1 h. Error bars represent standard deviations. ( B ) Quantification of γH2AX foci in the DT40 WT or FANCD2 − / − cell lines subjected to flavo-treatment for 1 h followed by 1 h release before imaging or cisplatin treatment for 1 h. Mean values and error bars representing 95% confidence intervals are indicated. Number of cells analysed is indicated ( n ). ( C ) Quantification of γH2AX foci in prometaphase/metaphase ( pro-meta ) or in anaphase/telophase DT40 WT, FANCD2 −/− or FANCL −/− cells untreated or subjected flavo-treatment for one hour followed by one hour release before fixation. Mean values and error bars representing 95% confidence intervals are indicated. Number of cells analysed is indicated (n). ( D ) Representative images of immunostained γH2AX foci in prometaphase/metaphase or in anaphase/telophase of WT, FANCD2 −/− or FANCL −/− cells untreated or subjected flavo-treatment for one hour followed by one hour release before fixation. DAPI/γH2AX merge as well as brightfield images are also shown. Scale bar: 5 μm. ( E ) Model depicting how RNAP II transcription stalling at a promotor proximal site induces an RNA–DNA hybrid, which in turn can cause a T–R conflict (co-directional or head-on) with approaching DNA polymerases (DNAP). The T–R conflict can be resolved by activating the TRe response that involves BLM, FANCD2 and BRCA2. BLM and FANCD2 are interdependent and BRCA2 depends on BLM (indicated by red arrows). It is uncertain whether BRCA2 and FANCD2 are interdependent and whether BLM rely on BRCA2 in the TRe (white arrows). If the TRe is impaired (indicated by the X), the T–R conflict will cause DNA damage and genomic instability. For all panels in this figure: * P < 0.05, ** P < 0.01, *** P < 0.001, **** P < 0.0001, Ns, not significant ( P > 0.05). Two-tailed t -test.
Article Snippet: Cells were blocked in PBS-T (PBS with 0.1% Tween20) with 3% BSA (A0281, Sigma-Aldrich) for 1 h before overnight incubation with primary
Techniques: Imaging, Two Tailed Test
Journal: bioRxiv
Article Title: Transcriptional silencing of ALDH2 in acute myeloid leukemia confers a dependency on Fanconi anemia proteins
doi: 10.1101/2020.10.23.352070
Figure Lengend Snippet: (A) Competition-based proliferation assays performed in 27 human cancer cell lines by lentiviral infection with the indicated sgRNAs linked to GFP. Timepoints (T) were collected every 2 days for leukemia cells or every 3 days for non-leukemia lines. Rate of GFP depletion indicate loss of cell fitness caused by Cas9/sgRNA-mediated genetic mutations. PDAC: Pancreatic Ductal Adenocarcinoma; SCLC: Small Cell Lung Cancer. (n=3). (B) Western blotting performed on whole cell lysates prepared from indicated cell lines, performed on day 4 following lentiviral transduction with indicated sgRNAs. (C) Competition-based proliferation assays comparing impact of sgRNAs (linked with GFP) on MOLM-13 cell fitness, in the context of co-transduction with UBE2T WT or sgRNA-resistant UBE2T cDNA. The sgRNA-resistant cDNA mutagenesis strategy is depicted. (n=3). (D) Competition-based assays measuring sgRNA (linked to GFP) effects on MOLM-13 cell fitness, in the presence of the indicated cDNAs. (n=3). (E) Competition-based proliferation assays in MOLM-13 cells lentivirally infected with indicated shRNA (linked to GFP) targeting FANCD2. (n=3). (F) (Left) Bioluminescence imaging of NSG mice transplanted with luciferase+/Cas9+ MOLM-13 cells infected with either sgNEG or sgFANCD2. (Right) Quantification of bioluminescence intensity. (n=5). All bar graphs represent the mean ± SEM. p-value is calculated by unpaired Student’s t-test. ***p < 0.001, **p < 0.01, *p < 0.05. All sgRNA experiments were performed in Cas9-expressing cell lines.
Article Snippet: Primary antibodies used in this study included UBE2T (abcam; Cat. No. ab140611),
Techniques: Infection, Western Blot, Transduction, Mutagenesis, shRNA, Imaging, Luciferase, Expressing
Journal: bioRxiv
Article Title: Transcriptional silencing of ALDH2 in acute myeloid leukemia confers a dependency on Fanconi anemia proteins
doi: 10.1101/2020.10.23.352070
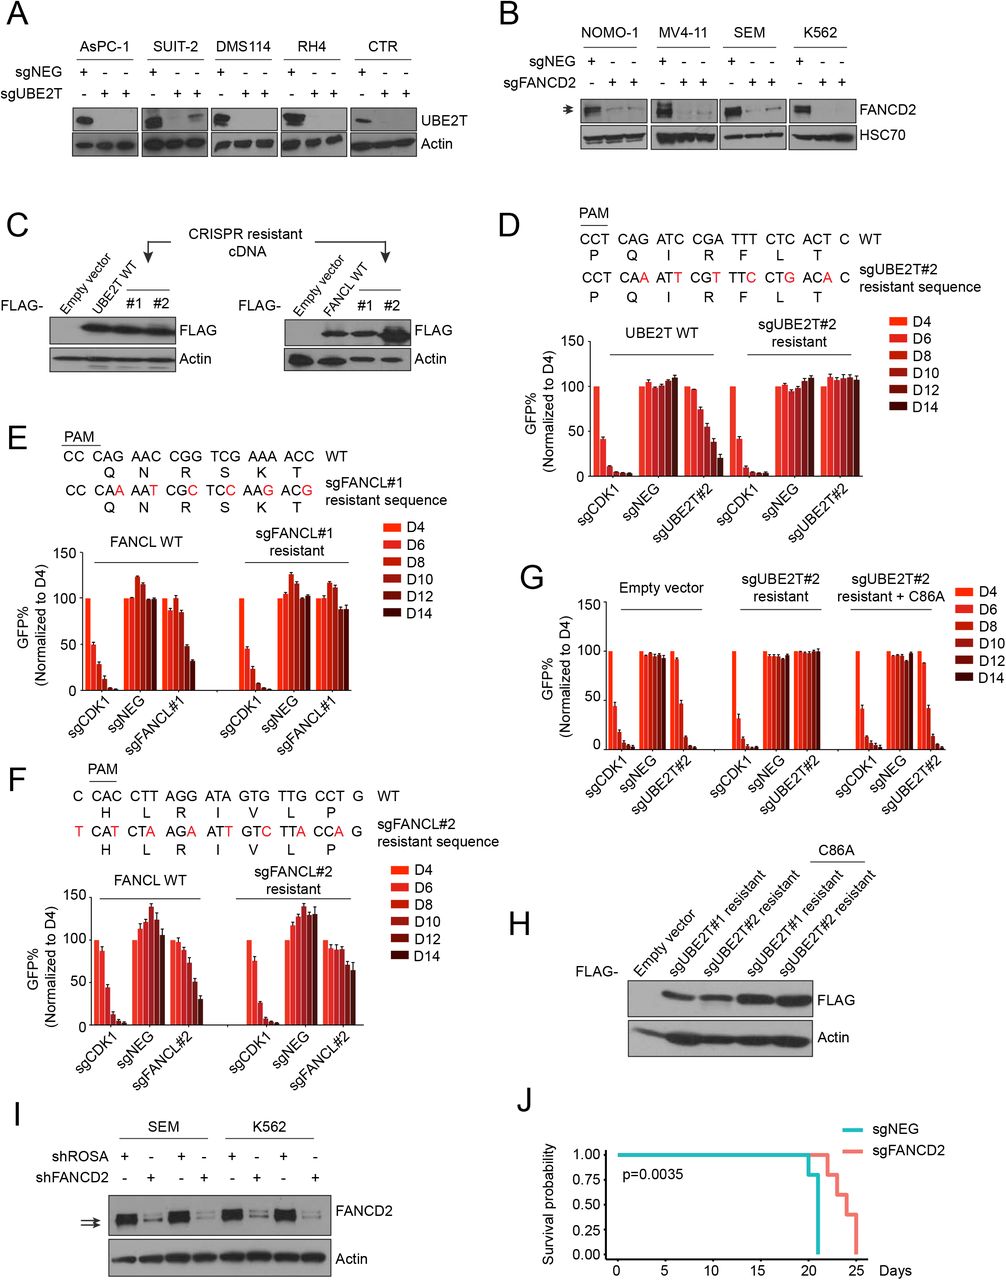
Figure Lengend Snippet: (A-B) Western blot performed on whole cell lysates of the indicated cell lines following lentiviral transduction with indicated sgRNAs. (C) Western blot analysis in MOLM-13 cells of FLAG-tagged UBE2T (left) or FANCL (right) with wild-type sequence or harboring silent mutations of the sgRNA recognition site. (D-G) Competition-based proliferation assay in MOLM-13 cells expressing the indicated cDNAs (wild or CRISPR-resistant, labeled at the top) transduced with GFP-linked sgRNAs (labeled at the bottom). (n=3). (H) Western blot analysis of FLAG-tagged UBE2T in MOLM-13 cells, carrying wild-type or various mutations. (I) Western blot analysis following transduction with shRNAs targeting FANCD2. (J) Kaplan-Meier survival curves of NSG recipient mice transplanted with MOLM-13 cell infected with indicated sgRNA. Each sgRNA group contains 5 mice. A log-rank (Mantel-Cox) statistical test was used to calculate the p-value. All bar graphs represent the mean ± SEM.
Article Snippet: Primary antibodies used in this study included UBE2T (abcam; Cat. No. ab140611),
Techniques: Western Blot, Transduction, Sequencing, Proliferation Assay, Expressing, CRISPR, Labeling, Infection
Journal: Communications Biology
Article Title: TopBP1 coordinates DNA repair synthesis in mitosis via recruitment of the nuclease scaffold SLX4
doi: 10.1038/s42003-025-08442-9
Figure Lengend Snippet: A , B Representative images of native metaphase spreads showing the colocalization of TopBP1 and EdU with FANCD2 or SLX4 on CAPH-marked chromatin after mild replication stress (0.4 µM APH, 16 h) in HeLa Kyoto cell line (NCAPH-mEGFP, TopBP1-Halo). CDK1i (RO-3306) was used for G2-synchronization prior to mitotic release. White arrows indicate foci on sister chromatids in boxed zoom. C Western blot showing degradation of endogenous TopBP1 after activation of mAID-SMASh double-degron tag in RPE1 cells. D Representative images and quantification of TopBP1, EdU, and FANCD2 foci in prometaphase cells. Statistical significance was evaluated by Student’s t -test ( n = 66 (control) or 100 (+IAA)). Horizontal lines in violin plots indicate median and dotted lines indicate quartiles. CDK1i (RO-3306) was used for G2-synchronization prior to mitotic release. E Quantification of FANCD2 foci in the experiment described in panel D .
Article Snippet: Following blocking, samples were stained with a primary
Techniques: Western Blot, Activation Assay, Control

Journal: Communications Biology
Article Title: TopBP1 coordinates DNA repair synthesis in mitosis via recruitment of the nuclease scaffold SLX4
doi: 10.1038/s42003-025-08442-9
Figure Lengend Snippet: A Representative images and quantification of TopBP1 twin foci per prometaphase (chromosomes condensed but not yet aligned along the metaphase plate) cell after untreated or replication stress conditions in HeLa Kyoto cell line (NCAPH-mEGFP, TopBP1-Halo). Orange arrows indicate TopBP1 twin foci. Statistical significance was evaluated by Student’s t -test ( n = 48 (control) or 52 (APH)). Horizontal lines in violin plots indicate median and dotted lines indicate quartiles. Notably, CDK1-inhibition was not used in this experiment. B Representative images of TopBP1 and FANCD2 twin foci in early mitosis (prophase/prometaphase). Dashed squares indicate two zoom regions containing colocalizing twin foci of TopBP1 and FANCD2 on condensed DNA (DAPI). Quantification of relative TopBP1 and FANCD2 focus intensities are shown in bar plot. A indicates the sister chromatid containing the most intense TopBP1 focus, while B indicates the sister chromatid with the less intense TopBP1 focus. Each data point represents quantification from one focus ( n = 37, 2 biological replicates). Notably, CDK1-inhibition was not used in this experiment. C Representative image of a native metaphase spread showing the localization of TopBP1 and FANCD2 on chromatin (visualized by CAPH). Numbers indicate sister chromatids shown in zoom view. 1–4 indicates four different types of TopBP1 and FANCD2 localization on chromatin (between sister chromatids, on chromatin, in gaps, and on telomeres) after mild replication stress (0.4 µM APH, 16 h). White arrow indicates a gap on the chromatin. D Representative images and illustrations of TopBP1-FANCD2 localization patterns on metaphase chromatin. A1–A4 illustrate asymmetric localization patterns between TopBP1 and FANCD2. S1–S4 illustrate symmetric localization patterns between TopBP1 and FANCD2. White arrows indicate the TopBP1-FANCD2 localization pattern illustrated below images. E Quantification of TopBP1-FANCD2 symmetry from data presented in ( C ). Pie-chart shows the percentages of symmetric/asymmetric patterns of TopBP1-FANCD2 foci on metaphase chromatin. Bar-plots show the percentage contribution of the different symmetric (S1–S4) and asymmetric (A1–A4) TopBP1-FANCD2 structures ( n = 458). C – E CDK1i (RO-3306) was used for G2-synchronization prior to mitotic release.
Article Snippet: Following blocking, samples were stained with a primary
Techniques: Control, Inhibition

Journal: Communications Biology
Article Title: TopBP1 coordinates DNA repair synthesis in mitosis via recruitment of the nuclease scaffold SLX4
doi: 10.1038/s42003-025-08442-9
Figure Lengend Snippet: A Illustrations of TopBP1-FANCD2-EdU localization patterns on metaphase chromatin in the HeLa Kyoto cell line (NCAPH-mEGFP, TopBP1-Halo). A1–A8 illustrate asymmetric localization patterns between TopBP1, FANCD2, and EdU. S1–S2 illustrate symmetric localization patterns between TopBP1, FANCD2, and EdU. B Quantification of TopBP1-FANCD2-EdU symmetry. Pie-chart shows the percentages of symmetric/asymmetric patterns of TopBP1-FANCD2-EdU foci on metaphase chromatin. Bar-plots show the percentage contribution of the different symmetric (S1–S2) and asymmetric (A1–A8) TopBP1-FANCD2-EdU structures ( n = 163). C Representative images of the two most highly represented symmetric/asymmetric localization patterns of TopBP1, FANCD2, and EdU. White box indicates area of zoom. White arrow indicates foci that colocalize with TopBP1. D Representative image of asymmetric structure A4. Dashed circles indicate areas of quantification, where intensities of TopBP1, FANCD2, and EdU were measured. A indicates the sister chromatid containing the most intense TopBP1 focus, while B indicates the sister chromatid lacking (or with very dim) TopBP1 focus. Quantification of relative TopBP1, FANCD2, and EdU focus intensities are shown in bar plot. Each triangle indicates quantification from an A4 asymmetric structure ( n = 15, 2 biological replicates). B – D CDK1i (RO-3306) was used for G2-synchronization prior to mitotic release.
Article Snippet: Following blocking, samples were stained with a primary
Techniques: